Nowhere to go: Idaho’s Homeless Families and Youth
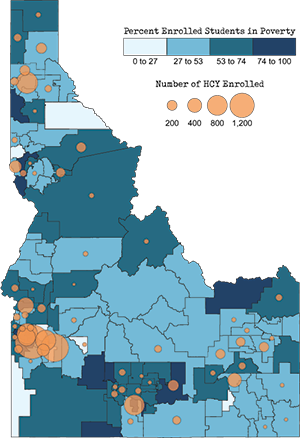
Idaho Homeless Enrollment by District Poverty Level

This map shows the correlation of poverty to homelessness in the state of Idaho. Statewide, approximately 45% of students qualify for free and/or reduced price lunches. National data trends show that approximately 5-10% of students qualifying for free and or reduced price lunch may be living in homeless situations.
On average the percentage of students living in McKinney-Vento eligible situations is 2.5% of our total student population.
In Idaho, we have students who have been identified as homeless living throughout the state in both urban and rural areas - though our more urban areas have a larger total number.
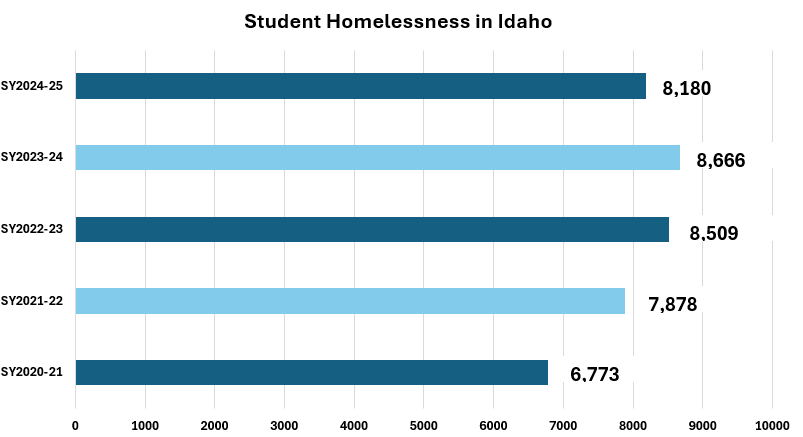
Student Homelessness in Idaho

Idaho Students with Homelessness in SY2024-25 is 8,180.
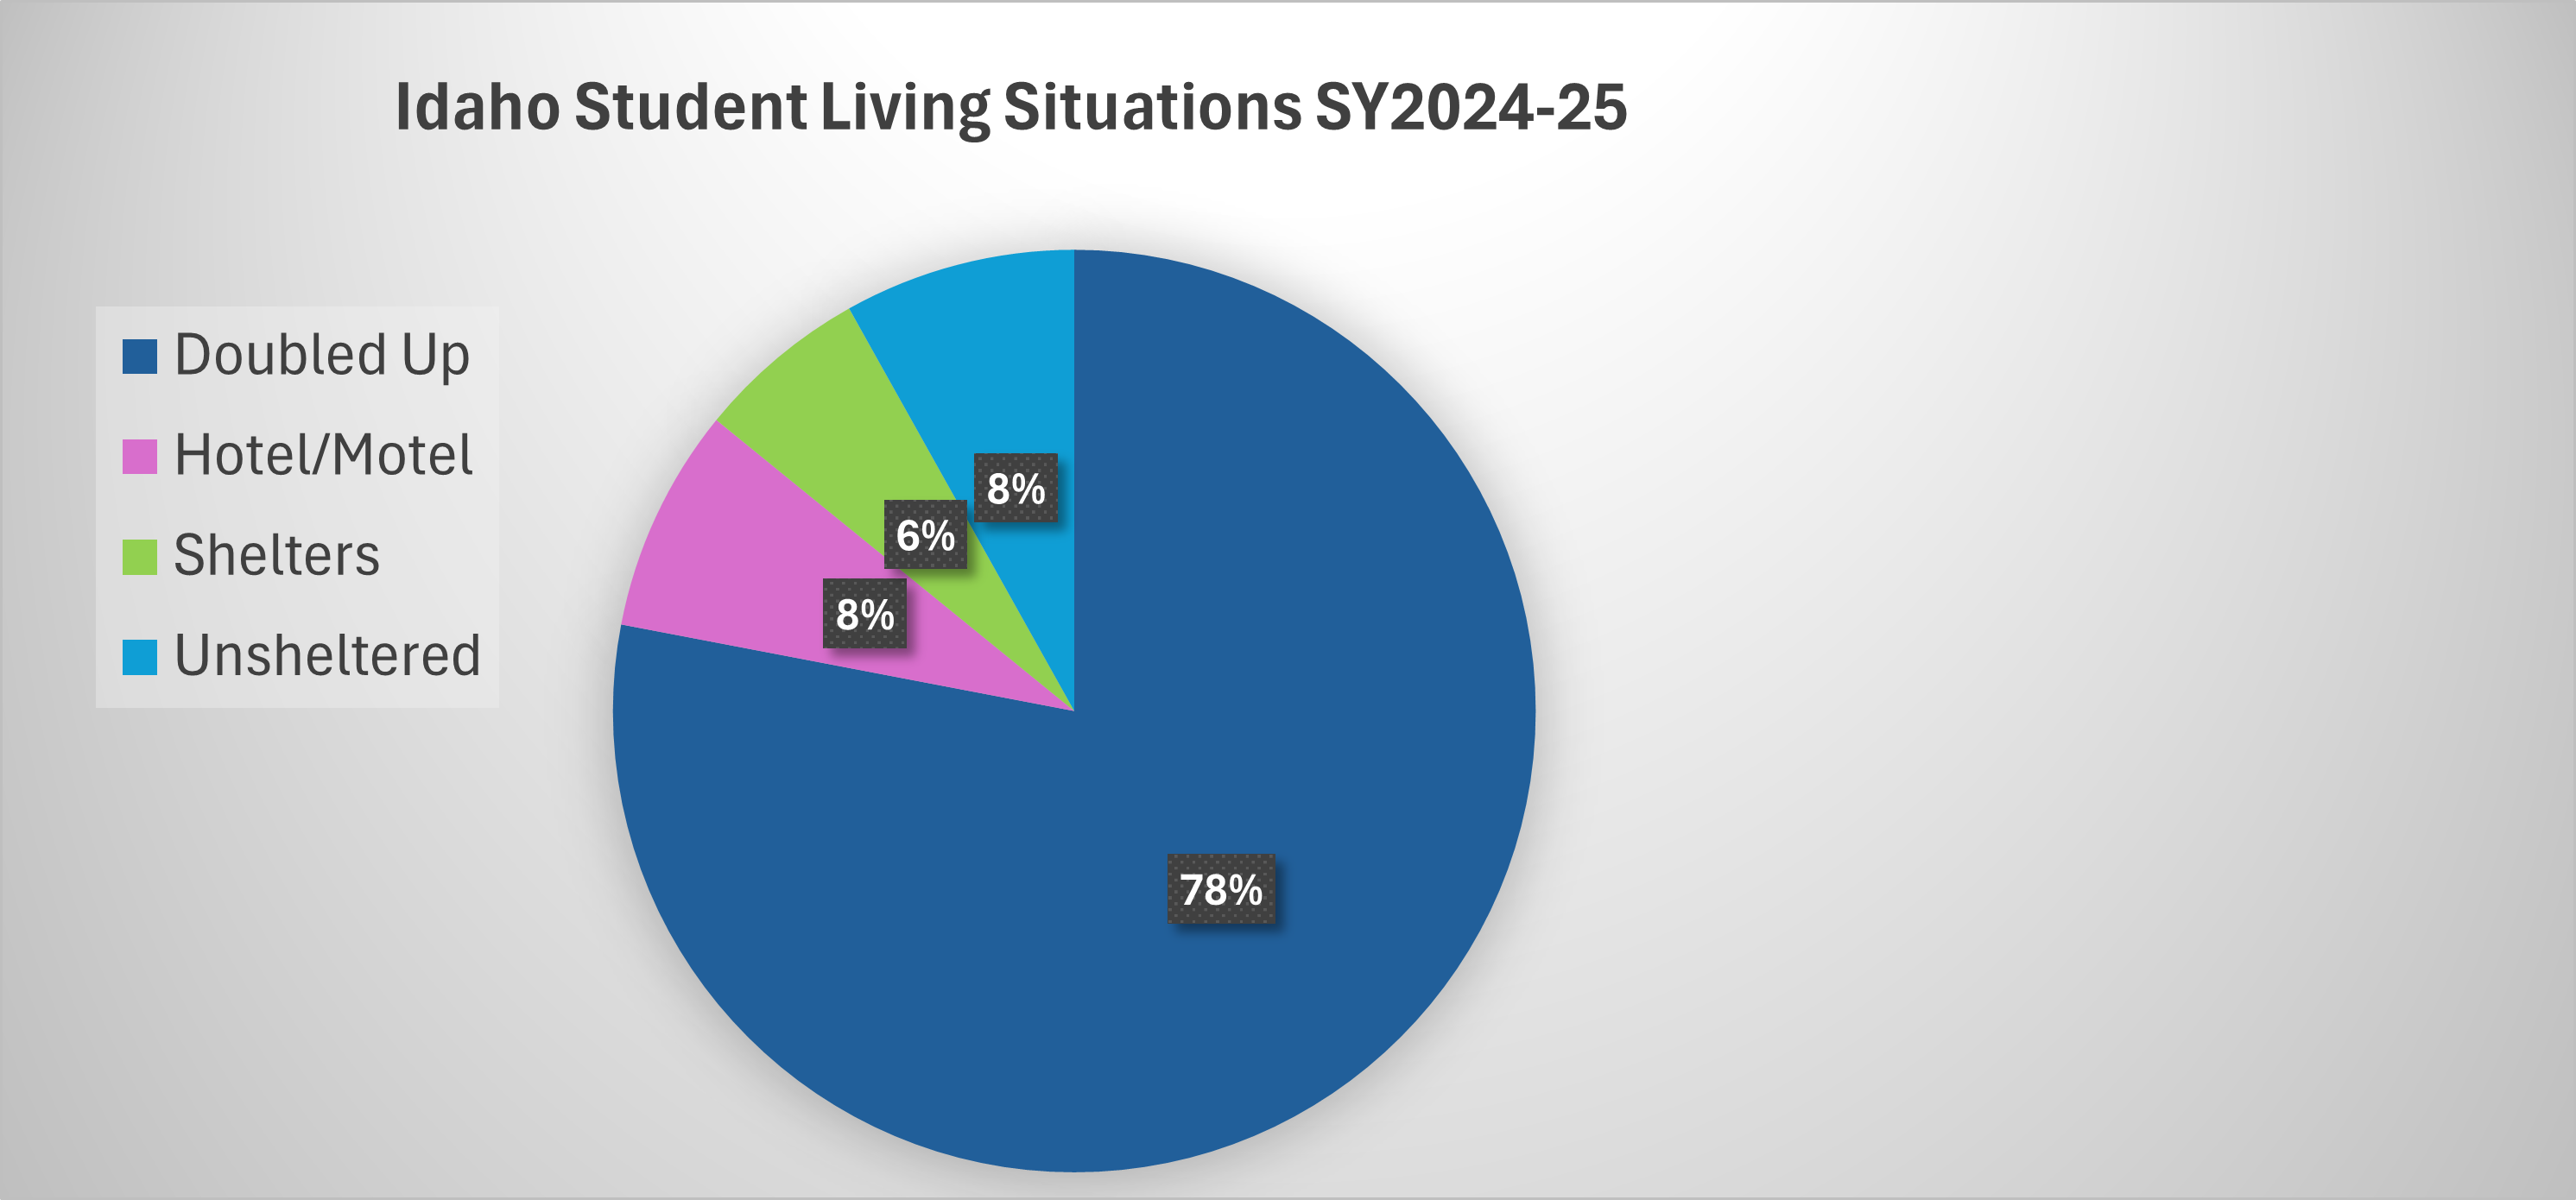
Idaho Student Living Situations

This chart shows the percentages of homeless students based on where they were living during 2024-2025:
- 6,381 were living in shared housing or doubled-up (living with friends of family
- 643 were living in hotels/motels
- 664 were unsheltered (living in cars, campers without utilities, or substandard conditions)
- 492 were living in shelters or transitional housing
Information comes from the district reported numbers.
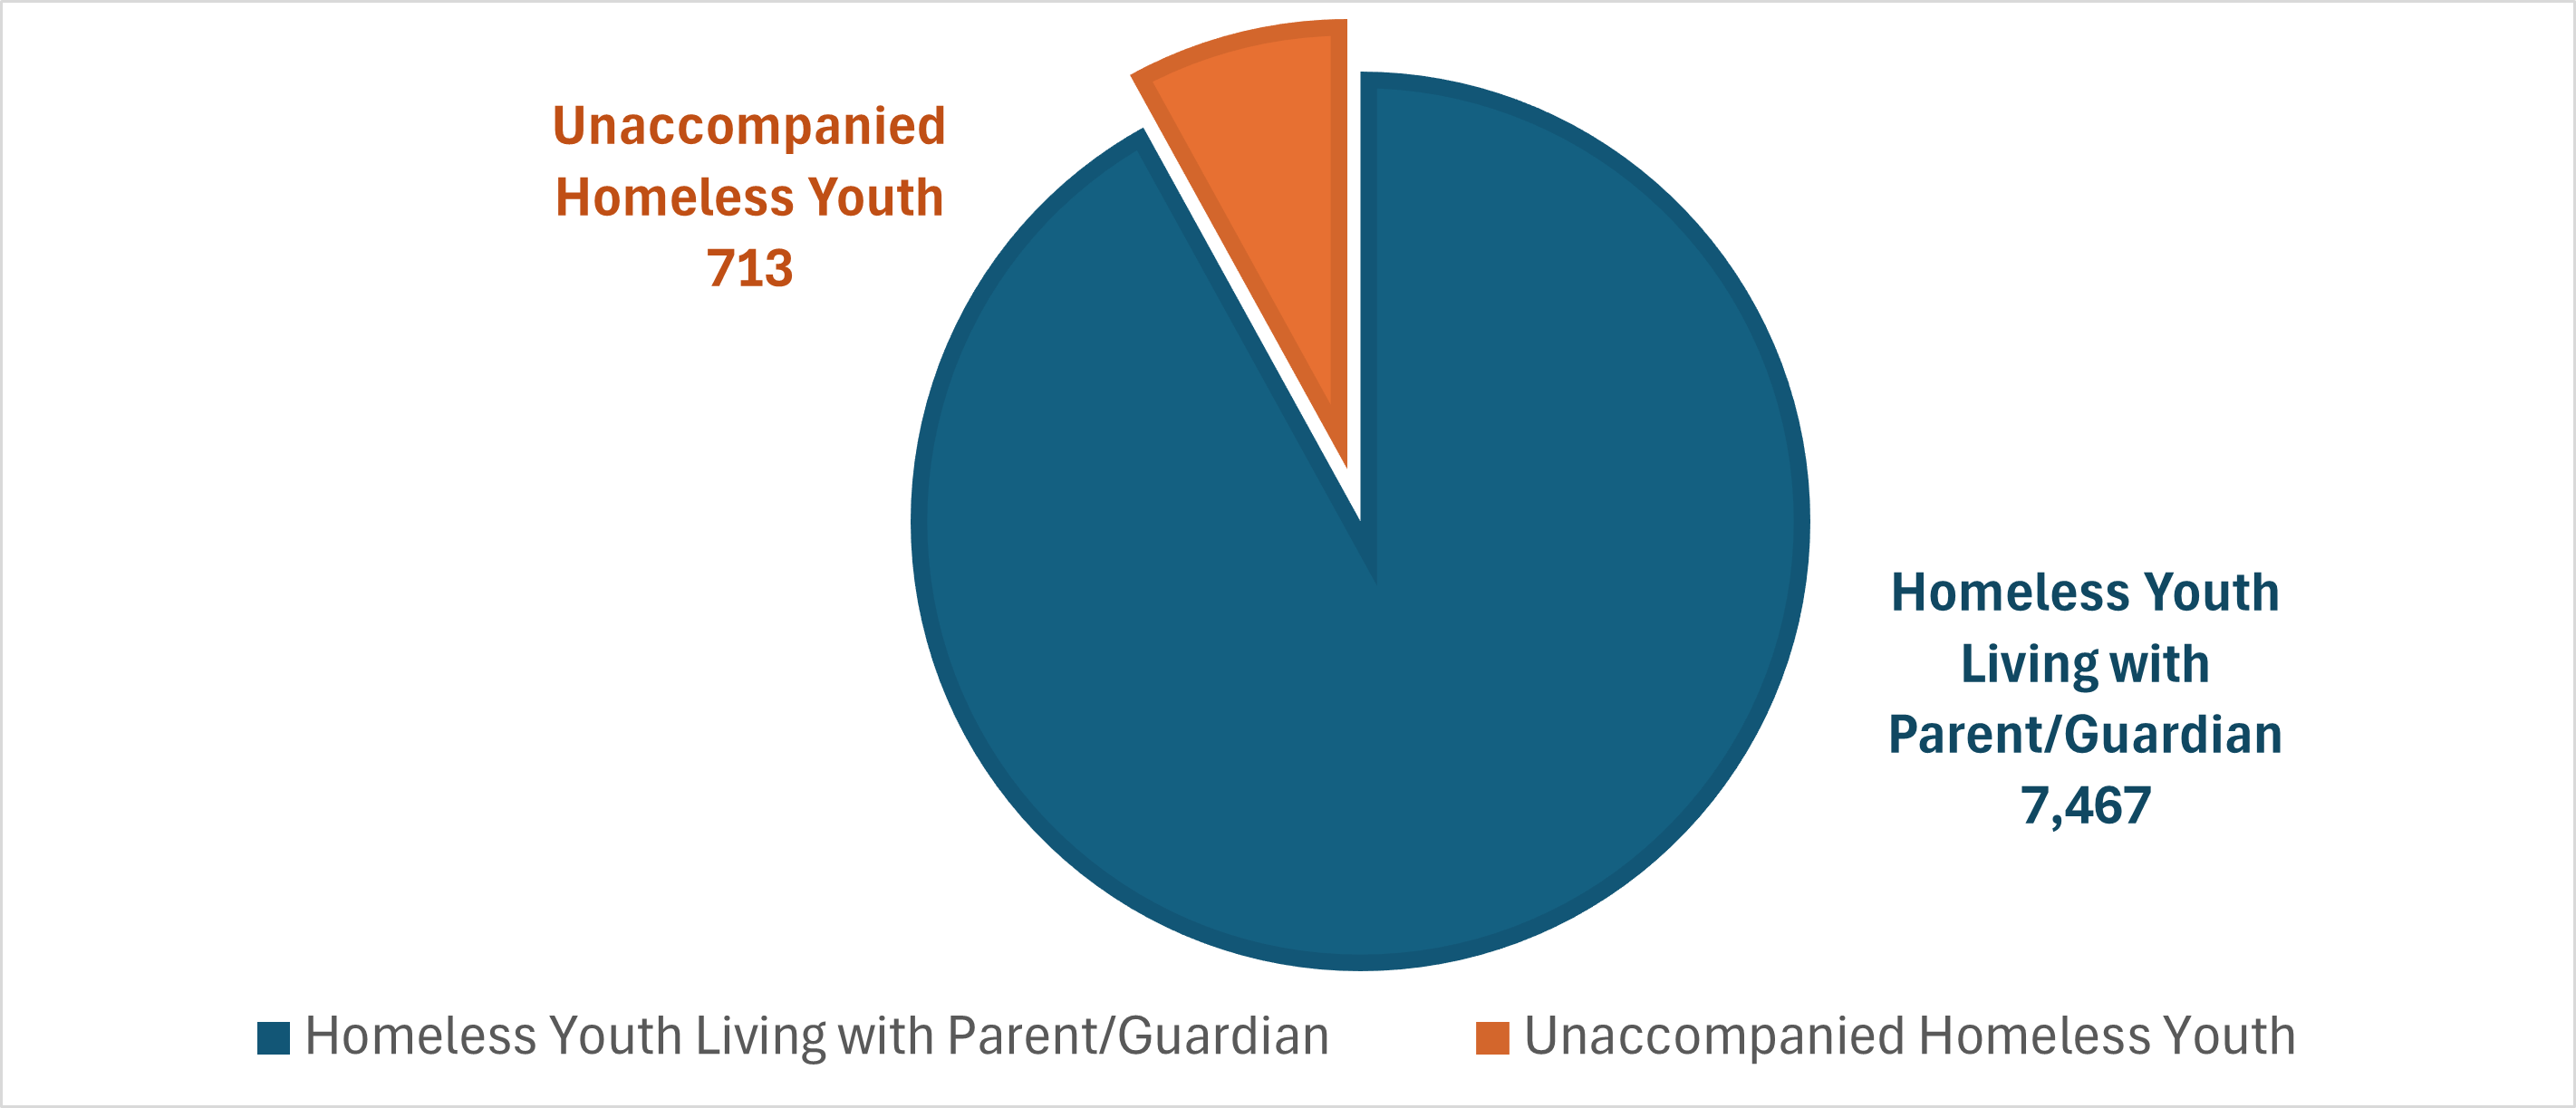
Unaccompanied Homeless Youth

An Unaccompanied Homeless Youth is an individual who meets the McKinney-Vento definition of lacking a fixed, regular, and adequate living situation AND is also not in the physical custody of his/her parent or guardian.